
Measuring employee performance and productivity is no longer as simple as tracking badge-ins or counting completed tasks. As enterprises adopt hybrid work policies, complex software stacks, and AI-driven workflows, business leaders face a central challenge:
How do you accurately measure work output without resorting to invasive micromanagement or relying on superficial vanity metrics?
Workforce productivity analytics provides the solution. By combining automated endpoint telemetry, process mining, and user behavior analysis, workforce data analytics translates digital activity into actionable intelligence. Instead of guessing where operational bottlenecks occur, organizations can objectively evaluate how time, software tools, and human effort convert into business results.
This guide explores how to:
- Establish a modern productivity measurement framework.
- Distinguish recorded activity from actual business output.
- Diagnose workflow friction.
- Leverage workforce analytics software to build high-performing, resilient teams.
Why is workforce analytics replacing traditional HR metrics?
Historically, human resources and operations teams relied on broad HR analytics to gauge organizational health. These traditional performance metrics (such as annual employee turnover rates, quarterly engagement surveys, and high-level time management logs) offered a retrospective view of the workforce.
While useful for macro-level workforce planning, legacy analytics failed to explain why specific teams struggled with operational efficiency or how employees executed their daily workflows.
The evolution from static HR reporting to predictive workforce analytics represents a fundamental shift in workforce management:
- From retrospective to continuous: Traditional methods analyze past outcomes (e.g., quarterly sales misses) long after the damage is done. Productivity analytics captures continuous, real-time behavioral telemetry, allowing managers to identify workflow friction as it emerges.
- From input-focused to context-aware: Legacy tracking counted raw hours logged or tasks completed. Modern analytics evaluates activity context; it differentiates active problem-solving from idle downtime, meeting fatigue, or context switching across disparate software tools.
- From aggregate data to process mining: Rather than viewing departments as black boxes, behavioral intelligence maps field-level process sequences across desktop and web applications, highlighting exact software friction points.
By focusing on operational execution rather than administrative headcount metrics, workforce productivity analytics bridges the gap between daily employee effort and your overarching business goals.
How do you accurately measure employee productivity using workforce analytics?
Measuring productivity across distributed and cross-functional teams requires a structured, multi-dimensional approach. Relying on a single metric creates blind spots, while tracking dozens of uncorrelated employee data points leads to analysis paralysis.
To build an objective, outcome-oriented productivity measurement system, follow this four-step implementation process:
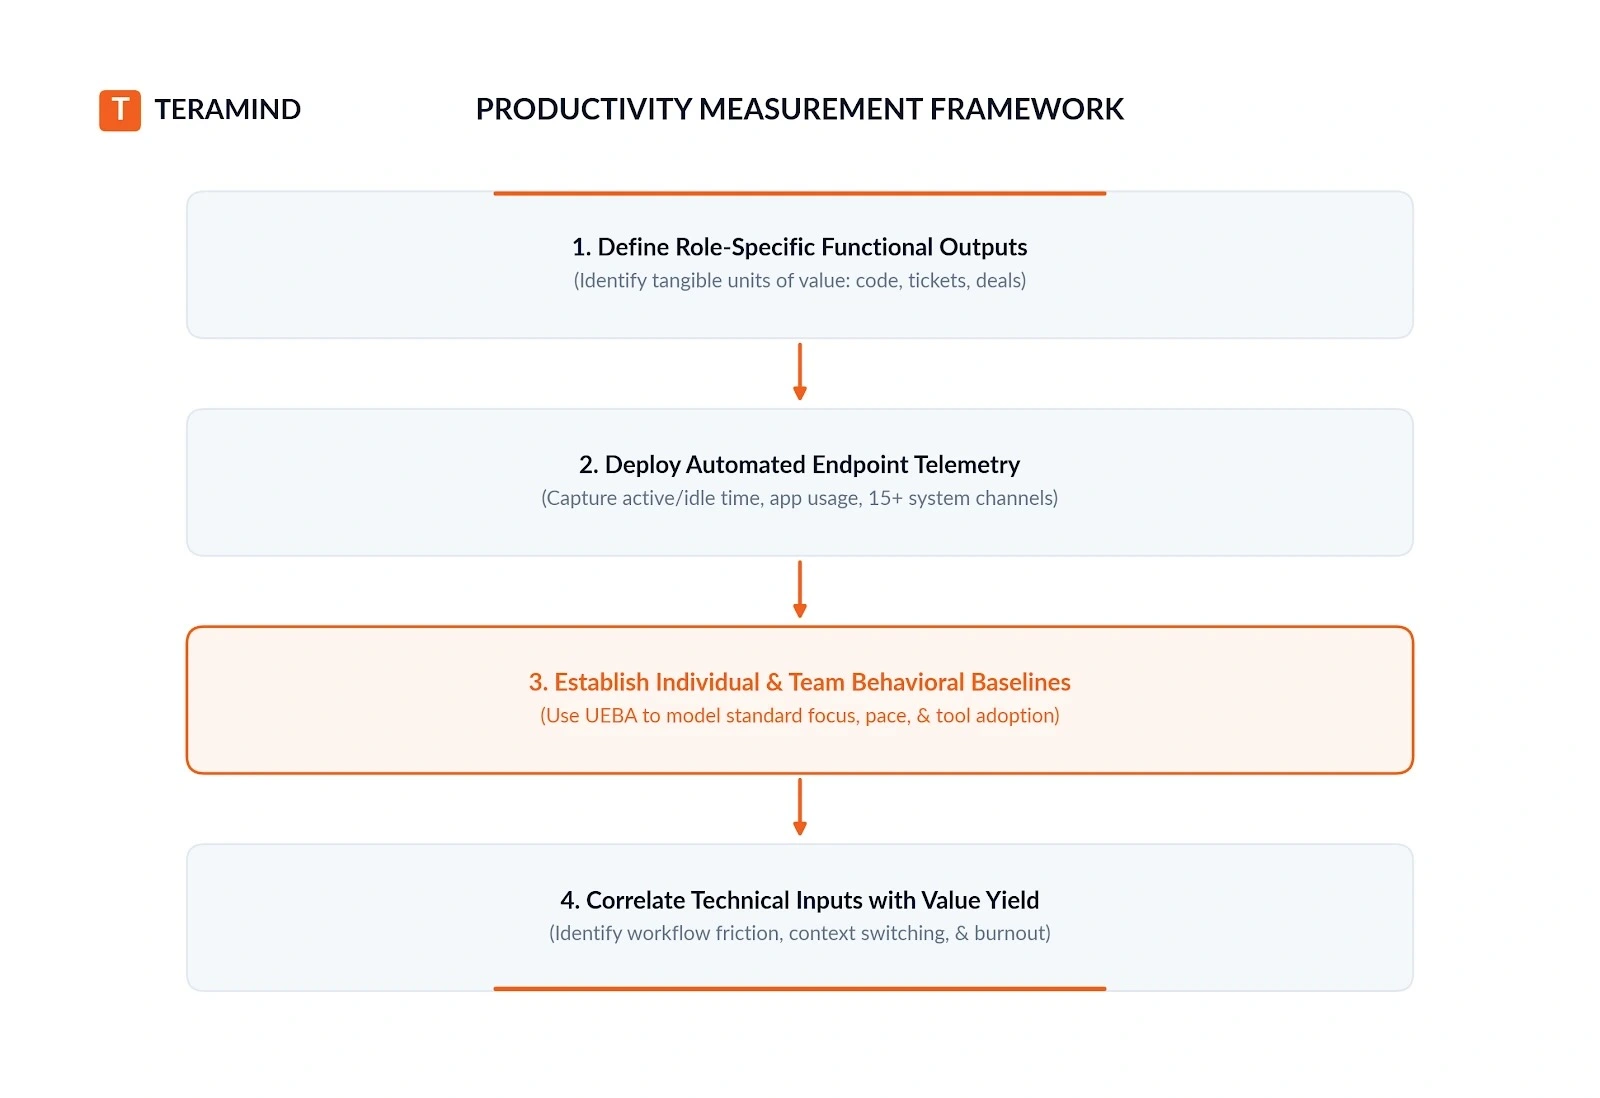
1. Define role-specific functional outputs
You can’t measure employee productivity identically across different functions. Establish clear, quantifiable deliverables for each role:
- Customer support: Ticket resolution volume, first-contact resolution (FCR) rate, and average handle time (AHT).
- Engineering: Pull requests merged, story points completed, and code review turnaround time.
- Sales operations: Lead response velocity, outbound activity efficiency, and opportunity pipeline advancement.
2. Deploy automated endpoint telemetry
Manual time tracking and self-reported activity logs are notoriously inaccurate and add administrative friction.
Implement automated endpoint analytics that capture system-level interactions across channels such as desktop applications, web browsing, file transfers, command line interfaces, and SaaS tools.
3. Establish individual and team behavioral baselines
Leverage User and Entity Behavior Analytics (UEBA) to build baseline work patterns over time.
By understanding standard working habits (such as peak focus hours, typical application context switching, and active-to-idle ratios), predictive analytics engines can identify meaningful deviations without flagging normal operational variance.
4. Correlate technical inputs with value yield
Compare digital activity data against functional business outcomes.
If a team's active computer hours remain high while target output drops, the cause is rarely employee effort; it’s almost always process inefficiency, fragmented tooling, or systemic workflow friction.
Which workforce metrics matter most?
To operationalize workforce productivity insights, you must track metrics across four key pillars: time and resource allocation, operational focus, process efficiency, and technology adoption.
The matrix below outlines key productivity metrics, their underlying formulas, data sources, diagnostic interpretations, and actionable management responses:
| Metric | Calculation / Formula | Data Source | Interpretation | Management Action |
|---|---|---|---|---|
| Active Time Ratio | (Active Workstation Hours / Total Scheduled Shift Hours) × 100 | Active vs. Idle Telemetry, System Input Logs | High ratio (>80%) indicates strong digital engagement. Low ratio suggests excessive offline meetings, administrative overhead, or unrecorded downtime. | Reallocate administrative burdens, reduce unnecessary standing meetings, or investigate manual offline processes. |
| Focus Time Index | Total daily duration of uninterrupted focus blocks (>30 mins) in core apps | Application & Website Usage Tracking | Measures deep work capacity. A low index indicates constant operational fragmentation from chat notifications, email, or meeting overload. | Institute structured "no-meeting" focus blocks, consolidate communication channels, and audit notification defaults. |
| Output Yield per Active Hour | Completed Work Units (Tickets, Code, Deals) / Total Active Workstation Hours | CRM / ERP / Jira / Ticketing Systems + Endpoint Telemetry | Evaluates functional conversion efficiency. Identifies how effectively active digital labor translates into business deliverables. | Document workflows of high-yield teams to build training templates for underperforming departments. |
| Context Switching Rate | Rapid window transitions (<15 seconds) between unrelated apps per hour | System Window & Desktop Analytics | High switching rates (>30/hr) indicate tool fragmentation, ambiguous Standard Operating Procedures (SOPs), or digital distraction. | Streamline SaaS tool stacks, build direct API integrations between core apps, and refine task delegation protocols. |
| In-App Process Cycle Time | Average time elapsed to execute specific form fields or UI task sequences | In-App Field Parsing & Process Mining | Measures task-level UI efficiency. Unusually long field-entry times signal complex software interfaces, missing auto-fill data, or system lag. | Optimize software UX, automate redundant field entries via scripts, or provide targeted software coaching. |
| Shadow AI & Unsanctioned Tool Index | Total daily interactions with unapproved web AI tools, apps, or extensions | Endpoint Shadow AI Discovery & Web Telemetry | High usage reveals gaps in corporate software provision. Employees adopt unapproved AI tools to bypass slow official processes. | Sanction enterprise-grade AI tools, implement prompt DLP guardrails, and update acceptable-use policies. |
What is the difference between recorded activity and actual output?
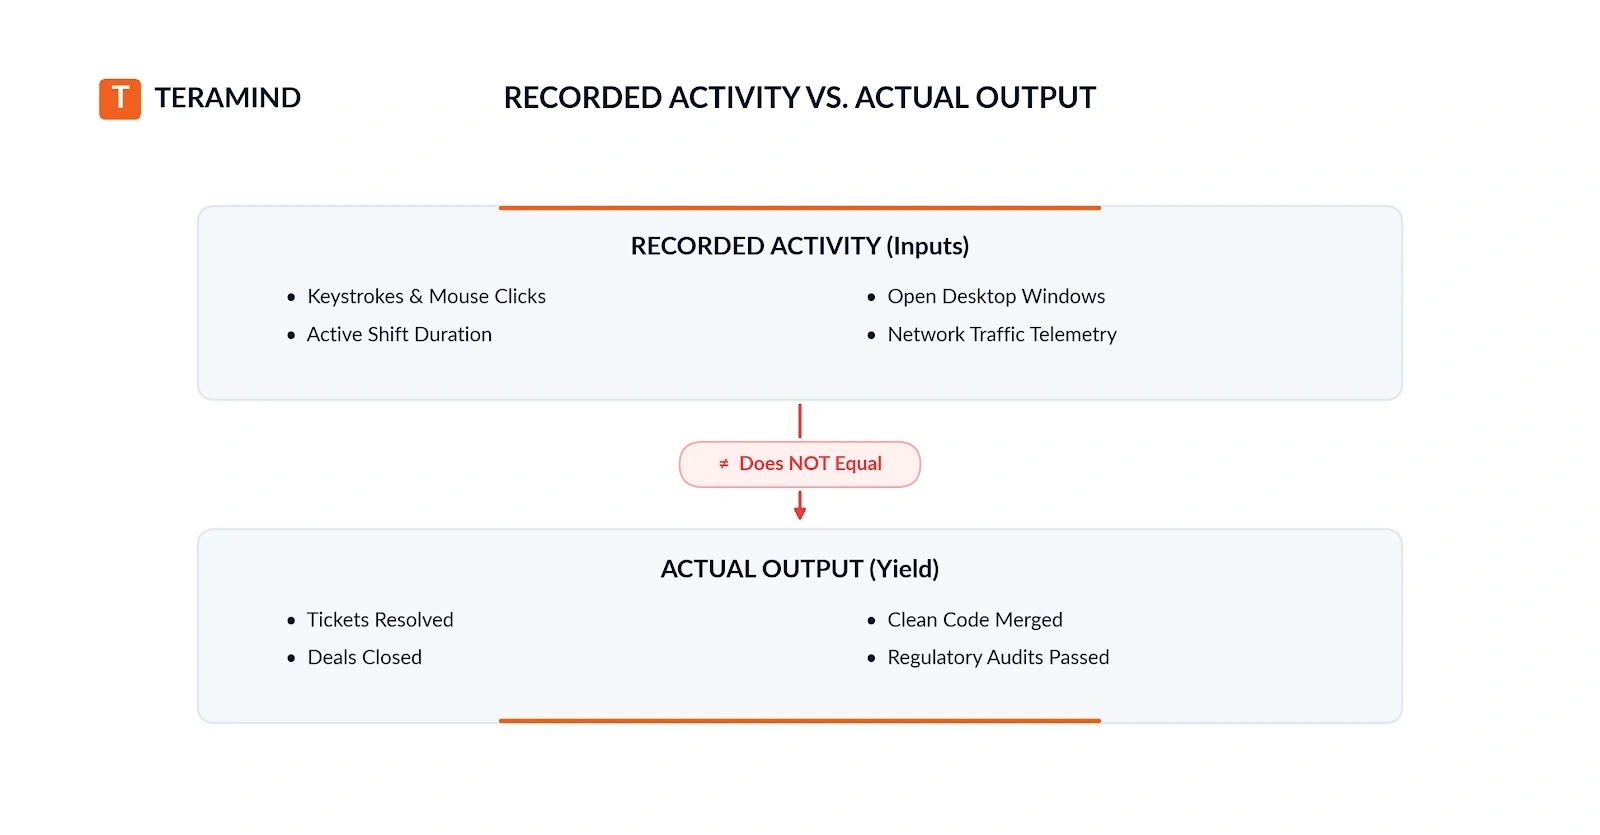
One of the most dangerous missteps in workforce analytics is confusing recorded activity with actual business output.
The pitfalls of superficial activity metrics
When organizations judge performance solely on raw activity metrics (such as total keystrokes, mouse distance, or constant active status), they unintentionally create misguided incentives. Employees quickly adapt by engaging in "surveillance dodging" behaviors:
- Using hardware mouse jigglers or software auto-clickers to maintain active status.
- Artificially inflating keystroke volume during basic tasks.
- Leaving unnecessary applications or video streams running to simulate active work hours.
Relying strictly on activity scores damages organizational trust, increases employee anxiety, and rewards artificial presence over genuine value creation.
The role of intelligent behavior analytics
Modern employee monitoring software solves this challenge by evaluating activity within its operational context. Intelligent User & Entity Behavior Analytics (UEBA) distinguishes between empty system inputs and meaningful work:
- Active vs. idle discrimination: Advanced tracking automatically separates active workstation interaction from passive desktop presence, meeting time, and idle downtime.
- Behavioral baselining: UEBA establishes normal patterns for each job role. An engineer reading documentation or writing complex logic will naturally register fewer keystrokes per minute than a data entry specialist, yet both are engaged in high-value work.
- Optical Character Recognition (OCR) and field parsing: With real-time OCR and field-level parsing, analytics engines can index on-screen text and form interactions. This provides verifiable proof of work context, such as actively navigating a client file in an ERP system, rather than just logging raw mouse movement.
- Real-time intervention: Unlike legacy UAM tools that only generate retrospective alerts, modern behavioral analytics platforms enforce proactive real-time intervention, e.g., issuing automated user coaching warnings or restricting risky data transfers the moment a policy boundary is crossed.
The goal of workforce analytics is not to track every keypress, but to treat activity data as a diagnostic context for understanding output variations.
How do you diagnose and resolve a productivity problem?
To understand how workforce productivity analytics operates in practice, consider a real-world enterprise scenario.
The scenario
A 40-person Tier-2 Customer Support team at a financial services firm experiences a 30% drop in weekly ticket resolutions over a single quarter. Management initially suspects falling employee engagement or burnout following a shift to a hybrid work model.
However, shift hours and self-reported time logs show that agents are logged in for 100% of their scheduled shifts.
Step 1: Endpoint telemetry and output isolation
HR and Operations teams deploy endpoint analytics to evaluate agent activity across system channels without resorting to invasive micromanagement:
- Output metric: Average ticket resolution rate fell from 45 tickets/agent/day to 31 tickets/agent/day.
- Activity metric: Active workstation hours remained stable at 7.6 hours per agent per day.
- Preliminary finding: The issue is not an input or effort failure; agents are actively working their full shifts.
Step 2: In-app process mining and context switching analysis
Operations managers drill down into application telemetry, context-switching rates, and in-app field interaction:
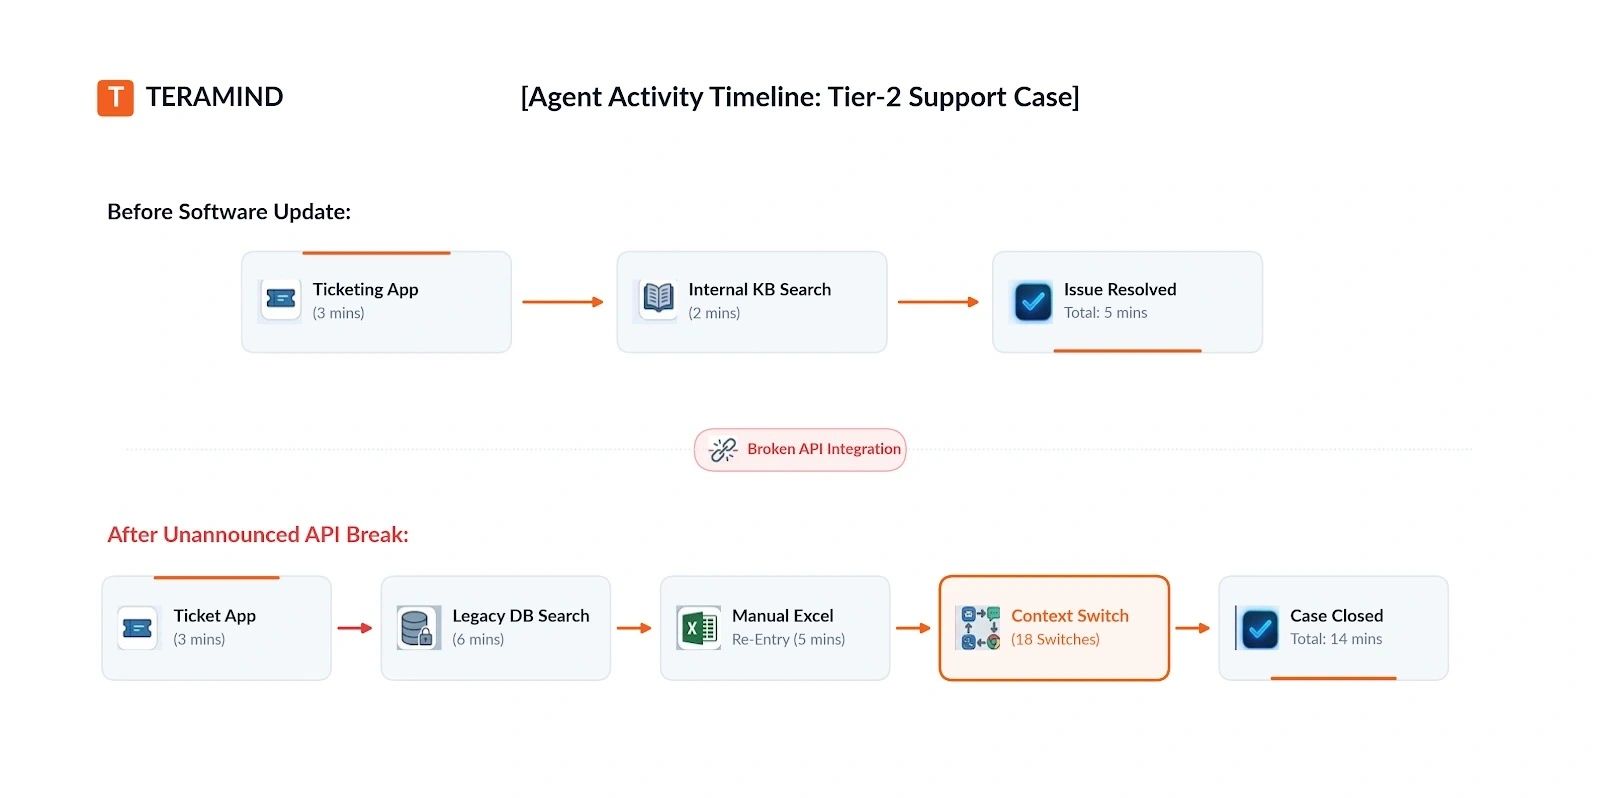
The telemetry reveals three critical operational anomalies:
- Context switching spike: Application switching between the main ticketing system, a legacy mainframe database, and local Excel workbooks spiked from 6 context switches per ticket to 18 context switches per ticket.
- Focus time degradation: Focus time blocks dropped by 55%, with agents spending over 40% of their active time performing manual copy-paste actions between open application windows.
- In-app field delays: In-app field parsing identifies that agents spend an average of 4.5 minutes per ticket manually copying policy numbers into a validation spreadsheet.
Step 3: Root cause discovery
By replaying anonymized session recordings and utilizing Optical Character Recognition (OCR) on the affected workflows, investigators discover the root cause:
- A recent silent infrastructure update broke the direct API integration between the primary ticketing platform and the customer database.
- To process tickets, agents were forced to manually query the legacy database, re-type validation codes into Excel, and verify customer identities across three separate screens.
- The productivity drop was caused entirely by broken software integration and bad SOP friction, not employee disengagement.
Step 4: Management action and measured ROI
Armed with concrete telemetry, management took targeted corrective action:
- Immediate fix: The IT engineering team restored the database API integration, eliminating the manual Excel verification step within 48 hours.
- Process automation: Operations created automated macros for residual manual data entries.
- Real-time intervention: Built-in automated coaching pop-ups were configured to guide agents through updated SOP steps whenever secondary database screens were opened.
Post-remediation results
- Ticket resolution rate: Restored to 48 tickets/agent/day (+54% increase from bottleneck state).
- Context switching rate: Reduced by 66%.
- Employee satisfaction: Agent satisfaction scores increased by 22 points due to the elimination of tedious manual data entry.
How do you balance productivity tracking with employee privacy and compliance?
While workforce analytics offers immense operational value, deploying monitoring technologies without strict privacy guardrails can damage workplace culture, trigger an employee backlash, and violate global legal frameworks.
Organizations must implement analytics solutions that prioritize transparency, data minimization, and employee wellbeing.
Ethical principles for people analytics
To maintain a high-trust culture while capturing operational telemetry, adhere to these core governance practices:
- Maintain complete transparency: Inform employees about what data is collected, how it’s analyzed, and how it will be used. Transparent policies eliminate the feeling of covert surveillance and build alignment around shared operational targets.
- Enforce selective tracking schedules: Restrict activity tracking to designated working hours or corporate devices. Automated tracking should pause outside shift hours or when an employee switches to personal mode on Bring-Your-Own-Device (BYOD) endpoints.
- Implement dynamic sensitive data masking: Ensure screen capture and logging systems automatically redact personally identifiable information (PII), protected health information (PHI), passwords, and payment data.
- Adopt Role-Based Access Controls (RBAC): Restrict access to raw activity logs, session replays, and behavioral reports. Department managers should only view aggregated team-level focus scores and process metrics, reserving granular forensic data for authorized HR or security investigations.
| Framework / Standard | Requirements & Description |
|---|---|
| GDPR / CCPA | Enforces privacy-by-design, data minimization, and rights-to-transparency for worker telemetry. |
| HIPAA | Requires automated masking of ePHI on screen capture and strict audit logging of medical data access. |
| ISO 27001 / SOC 2 Type II | Mandates formal information security controls, TLS encryption in transit, and tamper-proof evidence. |
Why is AI governance critical for modern workforce analytics?
As generative AI applications, desktop LLMs, and browser extensions flood the modern workplace, workforce analytics must also address Shadow AI governance.
Employees frequently leverage unapproved AI chatbots (e.g., ChatGPT, Claude) to draft emails, summarize documents, or write code.
While this can boost short-term productivity, it creates AI data exfiltration risks if corporate intellectual property or sensitive customer data is pasted into public models.
Modern endpoint analytics platforms provide dedicated Shadow AI discovery and real-time Data Loss Prevention (DLP) controls:
- Prompt and context inspection: Detect when sensitive customer data or proprietary source code is typed or pasted into AI prompts.
- Real-time user coaching: Automatically display warning pop-ups when employees open unauthorized AI tools, redirecting them to sanctioned instances.
- Behavioral velocity detection: Identify automated scripts or autonomous AI agents running at "superhuman" execution speeds, maintaining oversight over emerging AI technologies.
Why is Teramind an ideal workforce analytics tool?
Measuring productivity doesn't have to mean compromising the employee experience or guessing where process bottlenecks hide.
Teramind’s all-in-one unified platform combines workforce productivity analytics, insider risk management, endpoint DLP, and business process mining into a single, light-touch agent.
With 360-degree visibility across 15+ system channels, automated active/idle tracking, patented real-time OCR, and dedicated Shadow AI detection, Teramind gives operations, HR, and IT leaders the exact telemetry needed to eliminate friction and drive sustainable performance, backed by privacy-first masking and enterprise-grade compliance.
Take the next step:
- Try a Live Demo: Explore a live instance of Teramind in action to see our productivity dashboards, process mining, and user activity monitoring firsthand (no email or setup required).
- Start a Free Trial: Test Teramind across your team with a full-featured free trial and discover immediate workforce performance insights.
FAQs
How does a workforce analytics platform differ from intrusive employee surveillance software?
A modern workforce analytics platform like Teramind focuses on operational context, workflow optimization, and friction reduction rather than punitive micromanagement.
Legacy software monitors vanity inputs like raw keystrokes, mouse movement volume, or constant video feeds; metrics that encourage "surveillance dodging" and damage workplace trust.
In contrast, Teramind evaluates high-level focus time index, software cycle times, and application switching patterns to modernize performance management.
Built with privacy-first governance, it features selective tracking schedules, dynamic PII masking, and Role-Based Access Controls (RBAC) to ensure employee privacy while maintaining compliance with the GDPR, HIPAA, and CCPA guidelines.
How can workforce analytics help managers prevent burnout and maintain workload balance?
Workforce productivity analytics provides real-time visibility into operational fatigue. It helps leaders maintain a healthy workload balance across remote and hybrid teams.
By monitoring productivity trends (such as rising context-switching rates, shrinking focus time blocks, and persistent after-hours activity), managers can identify teams suffering from meeting overload or fragmented SaaS tools.
This objective telemetry enables operations leaders to optimize workload distribution, reallocate administrative burdens, and eliminate manual process friction long before burnout impacts employee retention or performance.
Can employees trick workforce productivity analytics using mouse jigglers or software auto-clickers?
No. Basic activity tracking tools that count raw mouse movements or keystroke volumes can easily be spoofed by hardware jigglers or auto-clicker scripts.
Teramind prevents input manipulation by leveraging intelligent User & Entity Behavior Analytics (UEBA), Optical Character Recognition (OCR), and in-app process mining.
By establishing behavioral baselines and correlating active workstation telemetry directly with functional outcomes (such as CRM updates, pull requests merged, or resolved tickets), the platform distinguishes empty system activity from actual business output.
How does workforce analytics improve performance management without relying on vanity metrics?
Traditional performance management relies on subjective feedback, retrospective annual reviews, or vanity metrics such as total hours logged or badge-in timestamps.
A unified workforce analytics platform replaces guesswork with actionable, outcome-oriented metrics across four core pillars: operational focus, resource allocation, process efficiency, and technology adoption.
By correlating active workstation hours with verified deliverables, management can conduct fair, data-driven performance evaluations based on output yield rather than active presence.
How does Teramind handle data security, employee privacy, and compliance standards?
Teramind is engineered with strict privacy-by-design principles to align with enterprise frameworks including the GDPR, CCPA, HIPAA, and SOC 2 Type II.
The platform allows organizations to:
- Limit tracking strictly to scheduled shift hours.
- Automatically pause monitoring on personal devices.
- Dynamically redact personally identifiable information (PII), payment card data, and medical records from screen captures and logs.
Additionally, Teramind includes dedicated Shadow AI discovery and real-time Data Loss Prevention (DLP) guardrails to prevent employees from entering sensitive intellectual property into unauthorized generative AI tools.
What is the expected deployment timeline and ROI when implementing workforce analytics?
Teramind deploys via a lightweight desktop agent available across cloud, hosted, or on-premises environments.
Organizations typically uncover immediate ROI within two weeks of deployment. By analyzing historical data and real-time productivity trends, operations leaders can:
- Pinpoint broken software integrations.
- Eliminate redundant software licenses.
- Fix uneven workload distribution.
- Recover up to 20% of lost focus time previously consumed by manual data entry and context switching.
